Update Dash to Latest Version
Last Updated :
01 Feb, 2024
Dash, a popular Python web framework for building interactive web applications, is continuously evolving with new features, enhancements, and bug fixes. To ensure you are leveraging the latest improvements, updating Dash to the most recent version is crucial. In this article, we’ll walk through the steps to update Dash in your Python environment. In this article, we will see how to update Dash to the latest version in Python.
How To Update Dash To Latest Version?
Below, is a step-by-step explanation of How To Update Dash To the Latest Version.
Step 1: Check Dash Current Version
Before updating, we can first check the dash version that is currently installed on the device. Below is the command by which we can check this:
pip show dash
Output:
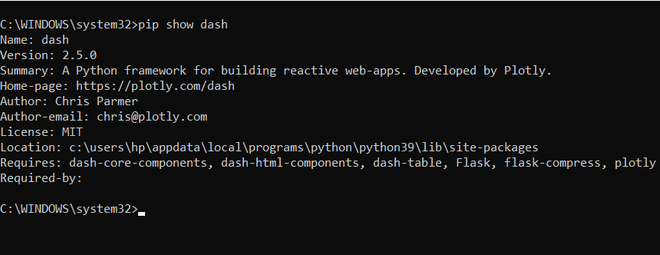
pip show dash
Step 2: Update Dash to Latest Version in Python
The primary tool for managing Python packages is pip. To update Dash to the latest version, open your terminal or command prompt and run the following command:
pip install dash --upgrade
This command tells pip to install the latest version of the Dash package, upgrading it if a previous version is installed.
Output:
-660.jpg)
dash upgrade
Step 3: Verifying the Dash Update
After the update, it’s essential to confirm that Dash has been successfully upgraded. You can use the following command to check the installed version:
pip show dash
Output:
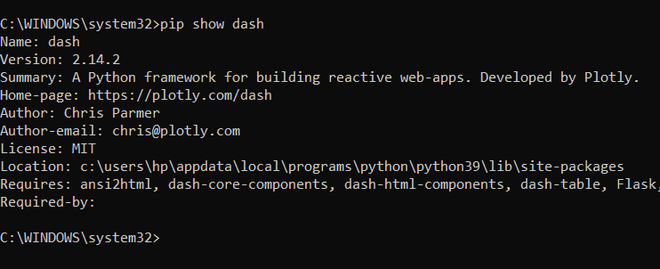
pip show dash
Basic Code Exampls of Dash
Below, are the code example of Dash .
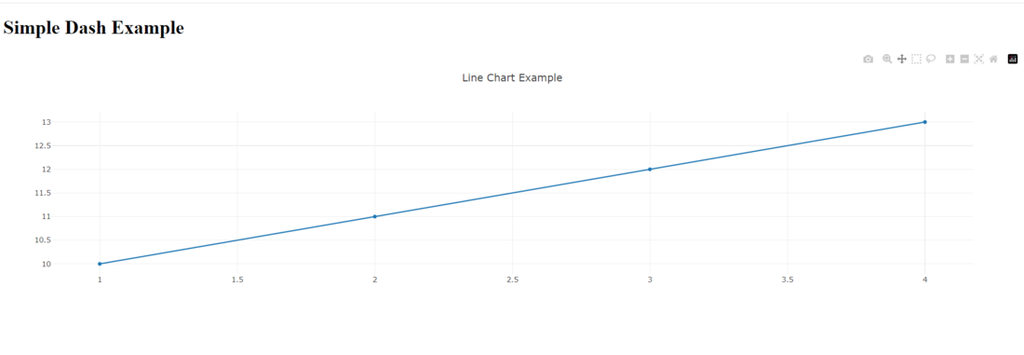
Example 1: Create Basic Dash App
In this example, below Python code utilizes the Dash framework to create a simple web application with a line chart. It imports necessary libraries, defines a Dash app with a basic layout, and generates a line chart using sample data. When executed, the app runs in debug mode, allowing visualization of the line chart at a specified server address.
Python3
import dash
import dash_core_components as dcc
import dash_html_components as html
from dash.dependencies import Input, Output
import pandas as pd
app = dash.Dash(__name__)
data = {'x': [1, 2, 3, 4], 'y': [10, 11, 12, 13]}
df = pd.DataFrame(data)
app.layout = html.Div(children=[
html.H1(children='Simple Dash Example'),
dcc.Graph(
id='example-graph',
figure={
'data': [
{'x': df['x'], 'y': df['y'], 'type': 'line', 'name': 'Line Chart'},
],
'layout': {
'title': 'Line Chart Example'
}
}
)
])
if __name__ == '__main__':
app.run_server(debug=True)
|
To run this example, save the code in a file (e.g., simple_dash_app.py) and execute it. Open your web browser and navigate to
http://127.0.0.1:8050/
Output:
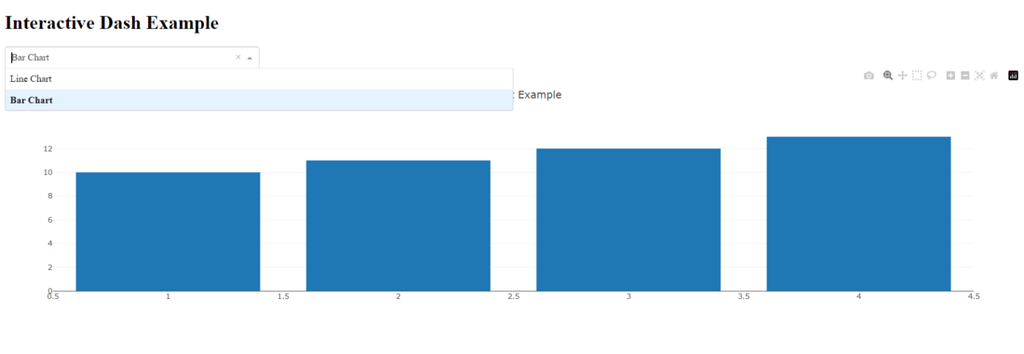
Example 2: Dash App with Interactive Components
In this example , below Python code defines a Dash web application with an interactive dropdown menu to switch between a line chart and a bar chart. The app includes a callback function that dynamically updates the displayed chart based on the user’s selection. The sample data is initially set for a line chart, and the app runs in debug mode when executed directly.
Python3
import dash
import dash_core_components as dcc
import dash_html_components as html
from dash.dependencies import Input, Output
import pandas as pd
app = dash.Dash(__name__)
data = {'x': [1, 2, 3, 4], 'y': [10, 11, 12, 13]}
df = pd.DataFrame(data)
app.layout = html.Div(children=[
html.H1(children='Interactive Dash Example'),
dcc.Dropdown(
id='chart-type',
options=[
{'label': 'Line Chart', 'value': 'line'},
{'label': 'Bar Chart', 'value': 'bar'}
],
value='line',
style={'width': '50%'}
),
dcc.Graph(id='example-graph')
])
@app.callback(
Output('example-graph', 'figure'),
[Input('chart-type', 'value')]
)
def update_graph(selected_chart):
if selected_chart == 'line':
chart_data = [{'x': df['x'], 'y': df['y'], 'type': 'line', 'name': 'Line Chart'}]
chart_layout = {'title': 'Line Chart Example'}
elif selected_chart == 'bar':
chart_data = [{'x': df['x'], 'y': df['y'], 'type': 'bar', 'name': 'Bar Chart'}]
chart_layout = {'title': 'Bar Chart Example'}
return {'data': chart_data, 'layout': chart_layout}
if __name__ == '__main__':
app.run_server(debug=True)
|
To run this example, save the code in a file (e.g., interactive_dash_app.py) and execute it. Open your web browser and navigate to
http://127.0.0.1:8050/
You should see an interactive Dash app with a dropdown menu to switch between line and bar charts.
Output:
Share your thoughts in the comments
Please Login to comment...